This is a transcribed Twitter thread from Trevor Bedford on Forecasting the Size of the Delta Wave
The Size of the Delta Wave
How big of a wave of #COVID19 do we expect in the US from the Delta variant? Here I describe a simple approach to this question and attempt a rough back-of-the-envelop estimate.
First off, epidemic size is determined by two primary factors:
1. Efficiency of onward transmission from an index case, commonly quantified as R0
2. Size of susceptible pool
Given a specified R0, we can calculate final epidemic size in a simple SIR model with the following equation where Z is final epidemic size. For initial R0 of 1.1, an epidemic is expected to infect 18% of the susceptible population. Before we get to Delta, we can see how this logic works with the fall/winter wave in the US. Here, state-level estimates of Rt were ~1.1 in Sep and Oct 2020 and declined to ~0.9 in Mar 2021 as the epidemic ran its course and left a wake of population immunity.
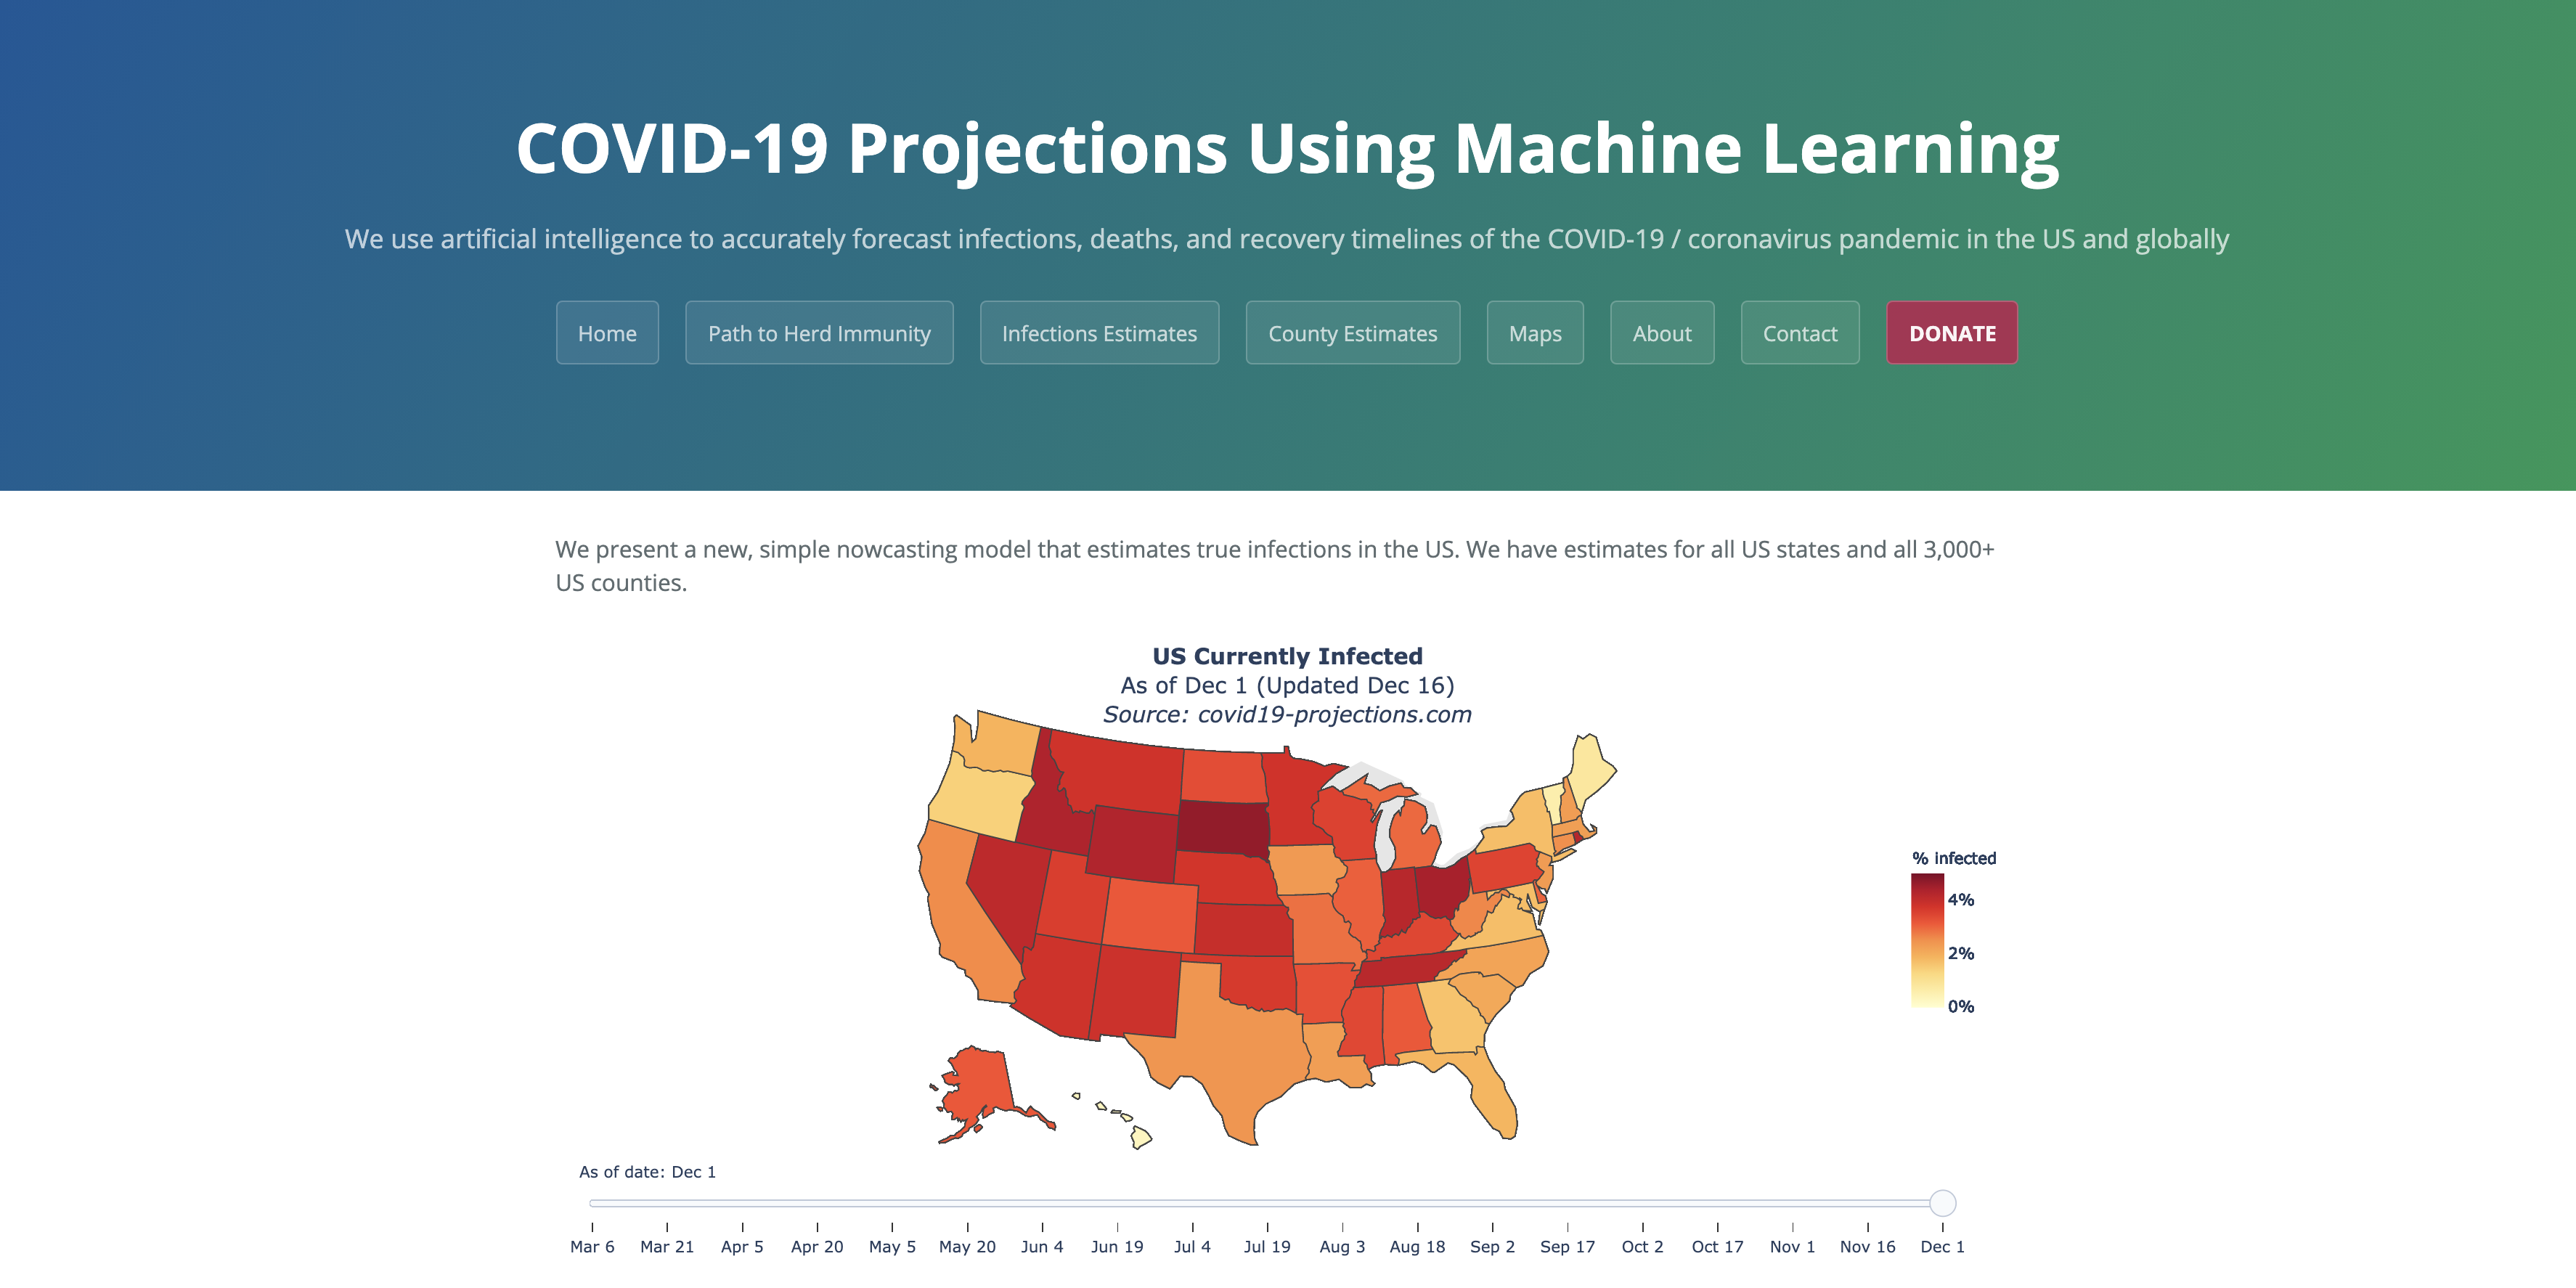
From Sep through Mar, the US reported 24M cases of COVID-19. If we assume 2.7 infections per reported case (via covid19-projections.com) we arrive at 65M infections in a population of 328M for ~20% of the US infected in the fall/winter wave.

COVID-19 Projections Using Machine Learning – covid19-projections.comWe use artificial intelligence to accurately forecast infections, deaths, and recovery timelines of the COVID-19 / coronavirus pandemic in the US and globallyhttps://covid19-projections.com/Notably, the (super rough) math seems to work here. Initial Rt of ~1.1 translated to ~20% of the population infected, which is close to the 18% mathematical expectation. We’ve recently seen rapid growth of Delta, where it’s displacing other circulating viruses in many states. Here, predominance of Delta in Arkansas, Colorado, Missouri and Utah occurred in only ~4 weeks. Variant-specific estimates of Rt from @marlinfiggins using @CDCgov case counts and @GISAID sequence data suggests Rt of Delta variant of 1.18 averaged across 20 states analyzed. I
nputting R0 of 1.18 in the final epidemic size equation yields 29% of the susceptible population infected in the Delta wave. 9/16 CDC lists 46% of the US population as fully vaccinated. Following covid19-projections.com, we take ~30% of the US population as having been infected. Assuming that vaccination and infection are independent yields 46% + 54% x 30% = 62% of the population with immunity.

This would imply that Delta has a susceptible pool of 38% of the US population and given final size of 29% would suggest 11% of the total US population infected with Delta or 36M people. A couple obvious places where this calculation is wrong. First, vaccination and infection are not independent and instead probably anti-correlated. This would imply a larger fraction of the population immune than the 62% used above. Second, vaccination is not perfect and vaccine efficacy against symptomatic disease drops from ~89% against Alpha to ~79% against Delta per @PHE_uk report (assets.publishing.service.gov.uk/government/upl…). Breakthrough infections imply a smaller fraction of the population immune than the 62%. I’d hope for these two effects to largely come out in the wash.
Another 11% of the population infected is of course substantial, though we expect lower rates of mortality on a per case basis due to vaccination coverage differing substantially across age groups (cdc.gov/mmwr/volumes/7…).

Although I don’t have a huge amount of faith in this specific 11% estimate, at the moment, just based on what’s happening in the UK, I would expect there to be a US wave driven by Delta (figure showing Rt in UK from epiforecasts.io/covid/posts/na…).


